
Chinese Real Estate Websites Monitoring Report in Q1 2017
Overview on the Environment of the Real Estate Industry in China
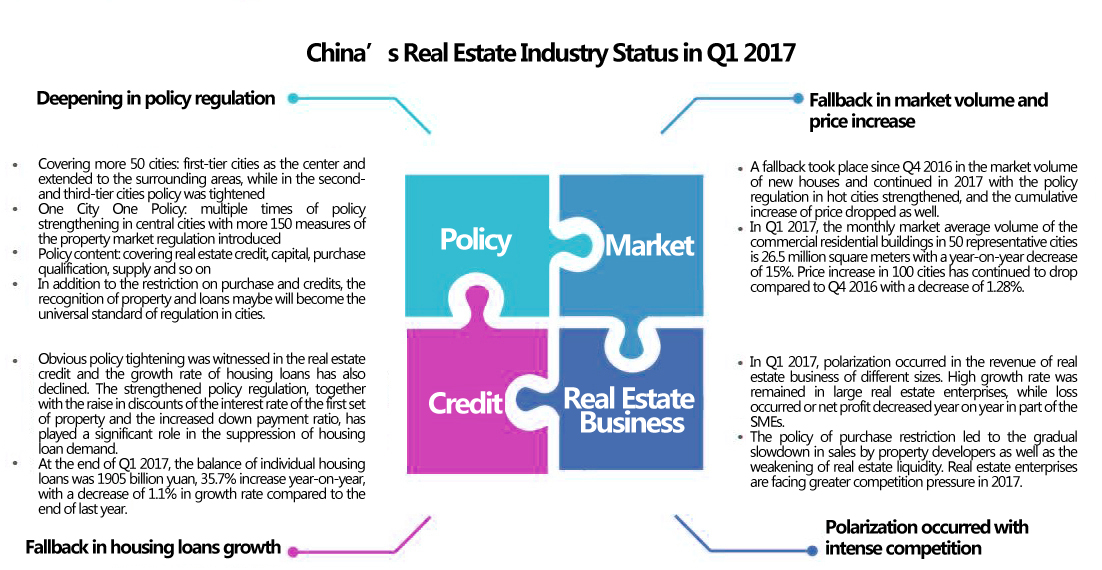
In Q1 2017, the regulation policy was continuously deepened and credit policy tightened with a fallback in market volume.
In Q1 2017, the real estate policy regulation was continuously deepened, which took the first-tier cities as the center and extended to the surrounding areas, while in the second- and third-tier cities policy tightening was showed. Tightening credit policy has played a significant role in the suppression of mortgage demand. Under this policy environment, a fallback took place in the market volume of residence and land, and polarization occurred in the revenue of real estate business with intense competition.
Overview on the Environment of the Real Estate Industry in China
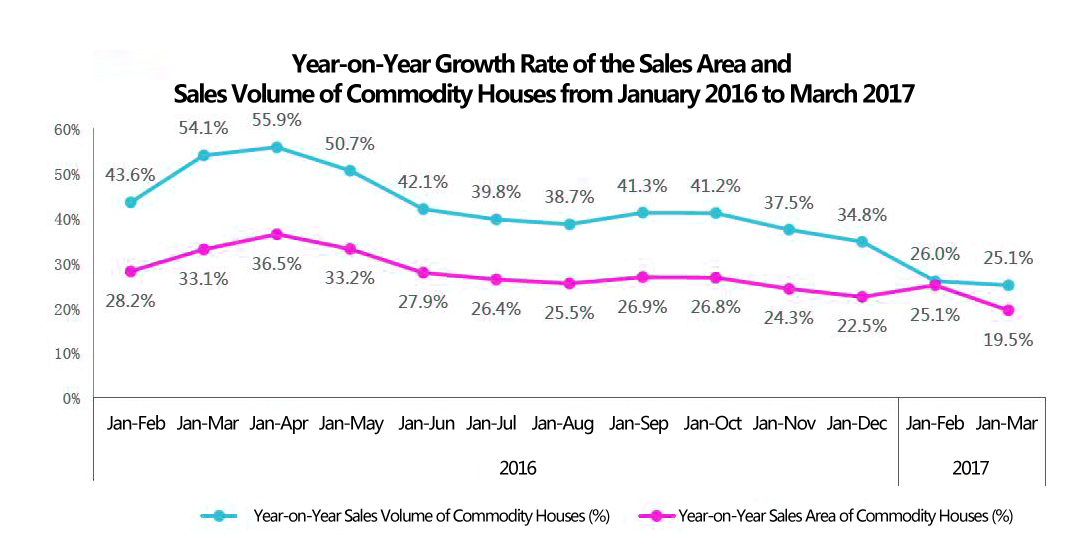
The growth rate of the accumulated sales area and sales volume of commodity houses fell back year on year in Q1 2017.
According to the data from National Bureau of Statistics, in Q1 2017, the sales area of commodity houses reached 290.35 million square meters, an year-on-year increase of 19.5%, with a 5.6% decrease in growth rate compared to January and February, among which the sales area of residential houses increased by16.9%, office building 52.9% and commercial property 35.6%. The sales volume of commodity houses was 2318.2 billion yuan with an increase of 25.1% and 0.9% decrease in growth rate. Among them, the sales volume of residential houses increased by 20.2%, office buildings 67.9% and commercial property 49.3%. Compared to Q4 2016, the growth rate of the monthly cumulative sales area and sales volume continued to slow down year on year in Q1 2017.
Overview of Advertising on Real Estate Websites in China
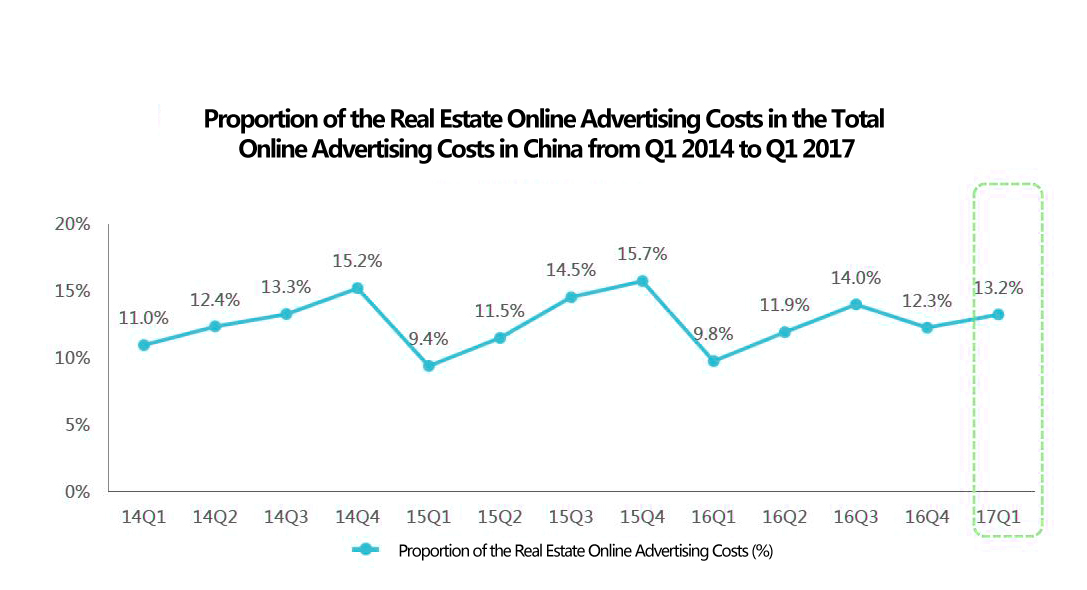
In Q1 2017, the proportion of the online advertising costs of real estate increased to 13.2%.
According to the monitoring data, in Q1 2017, the online advertising costs of real estate accounted for 13.2% in the total online advertising costs with an increase of 1.0% compared to last quarter and 3.5% year on year.
Overview of Advertising on Real Estate Websites in China
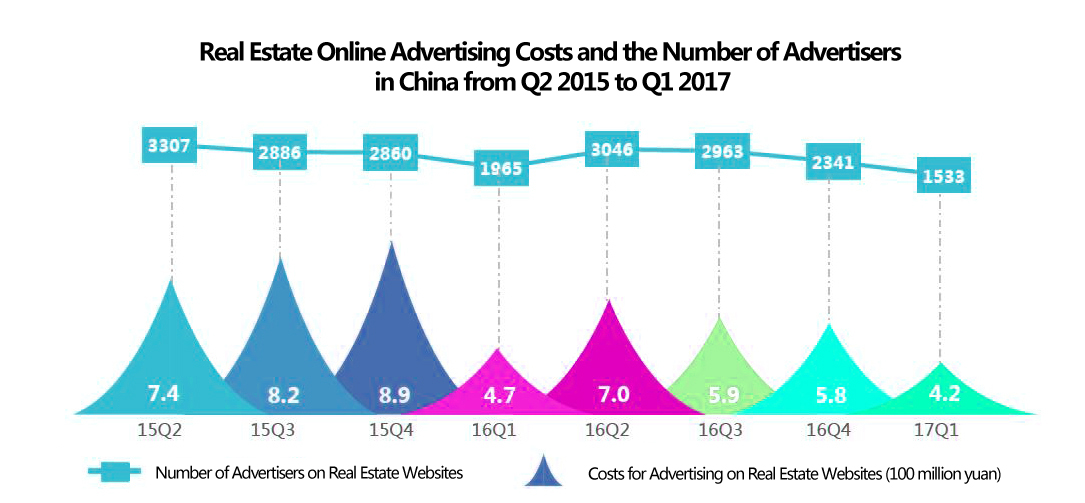
In Q1 2017, the overall online advertising costs and the number of advertisers reduced.
According to the monitoring data, in Q1 2017, the overall advertising costs of real estate reached to 420 million yuan. Although the proportion of real estate advertising in the overall online advertising has risen, the total costs of real estate online advertising has declined compared to Q4 2016 in absolute amount with a year-on-year decrease of 10.1% and a quarter-to-quarter decrease of 27.2%. For the number of advertisers, it has reduced to 1533 with a decrease of 22.0% year on year and 34.5% decrease quarter to quarter.
Overview of Advertising on Real Estate Websites in China
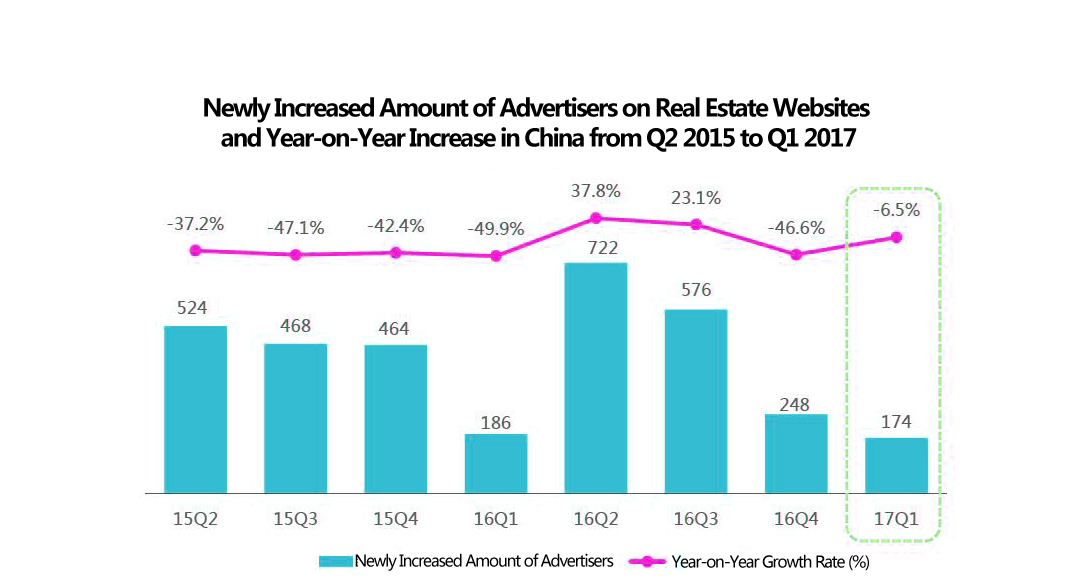
In Q1 2017, the newly increased amount of advertisers continued to decrease.
Compared to Q4 2016, the newly increased amount of advertisers continued to reduce in Q1 2017 with a decrease of 29.8% and a year-on-year decrease of 6.5%. Overall, real estate advertisers are still in cautious and wait-and-see mode for online marketing investment in Q1 2017.
Overview of Advertising on Real Estate Websites in China
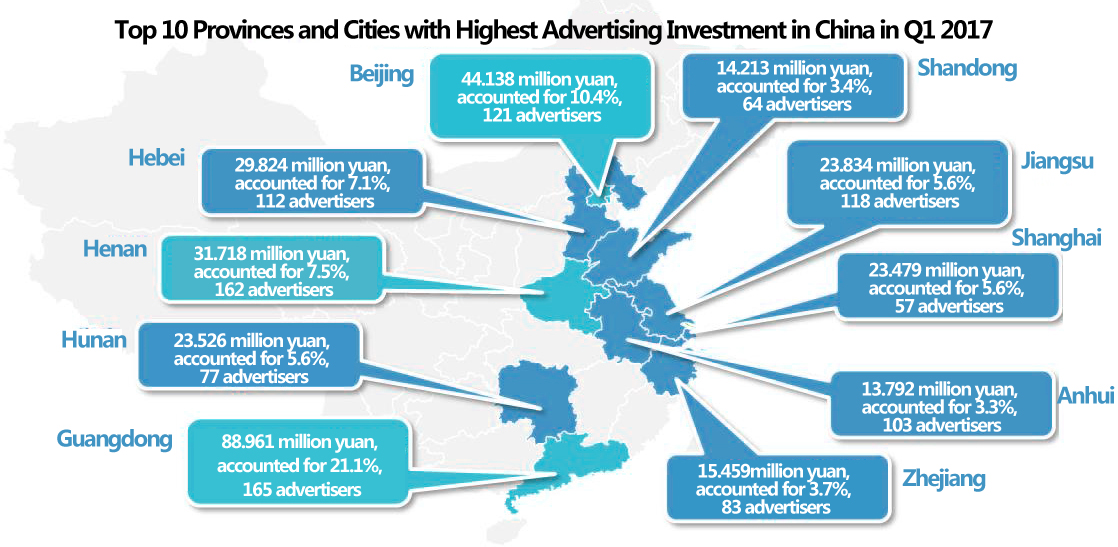
Advertisers in Guangdong, Beijing and Henan are leading in the number and amount of real estate online advertising.
According to the monitoring data, Advertisers in Guangdong, Beijing and Henan ranked the top 3 nationwide in the amount of real estate online advertising and the number of advertisers in Q1 2017. Among them, Guangdong got the largest amount of real estate online advertising, which was 88.961 million yuan and accounted for 21.1% of the national amount with 165 advertisers. The amount of real estate online advertising in Beijing reached to 44.138 million yuan and accounted for 10.4% of the national amount with 121 advertisers, while in Henan the amount was 31.718 million yuan and accounted for 7.5% with 162 advertisers
Overview of Advertising on Real Estate Websites in China
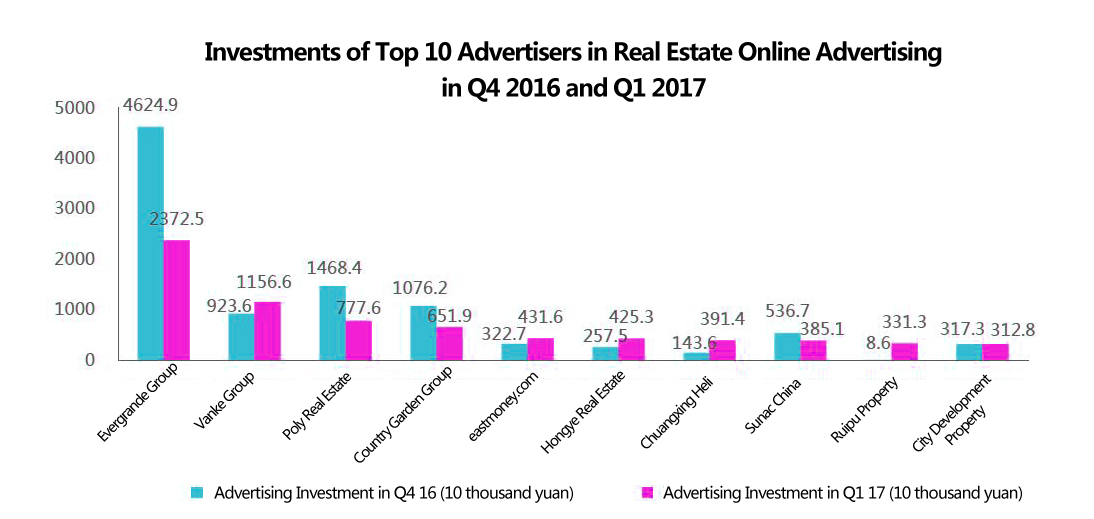
Five among the Top 10 advertisers in Q1 2017 increased investment in online advertising compared to Q4 2016.
In accordance with the investment of the Top 10 advertisers in online advertising in Q1 2017, the Top 3 advertisers were the same but their ranking has changed. Evergrande Group still ranked Top 1, but its advertising investment of 23.725 million yuan in Q1 2017 was lower 19.0% than Q4 2016. As No. 2, Vanke Group invested 11.566 million yuan in online advertising in Q1 2017 with an increase of 25.2% compared to Q4 2016. Poly Real Estate, ranking No. 3, invested 7.776 million yuan with a decrease of 47.0% quarter to quarter. Among the top 10 advertisers, the investment in online advertising of Vanke Group, eastmoney.com, Hongye Real Estate, Chuangxing Heli and Ruipu Property has been increased in Q1 2017 compared to Q4 2016.
Overview of Visitors to Real Estate Websites on PC in China in Q1 2017
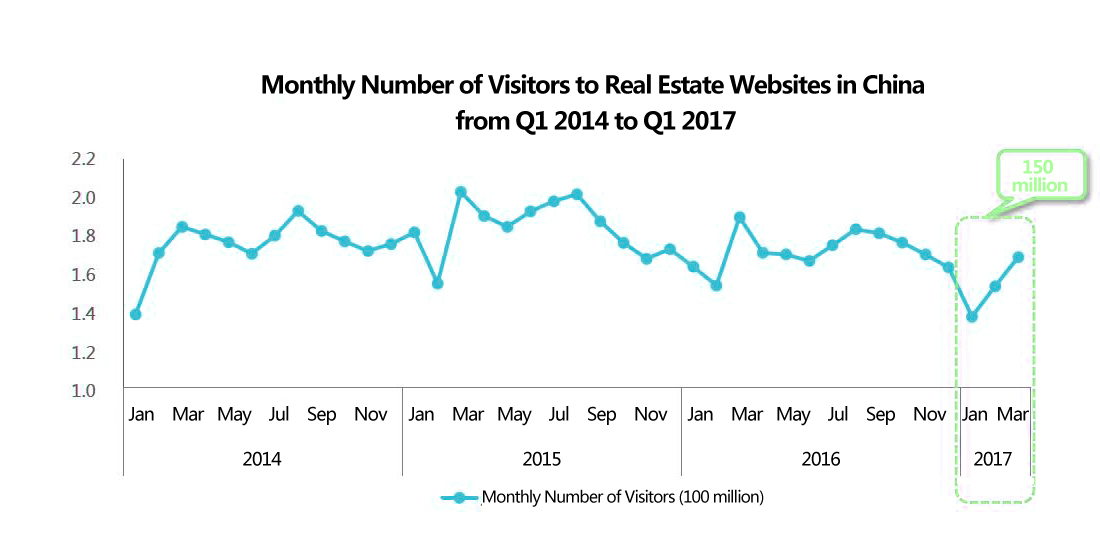
In Q1 2017, the number of visitors to real estate websites on PC continued to decline compared to Q4 2016.
According to the monitoring data, real estate websites had 150 million visitors on PC in Q1 2017, falling 9.8% from the previous quarter and decreasing 9.4% from a year earlier, but showing a rising trend on a monthly basis from January to March.
Overview of Visitors to Real Estate Websites on PC in China in Q1 2017
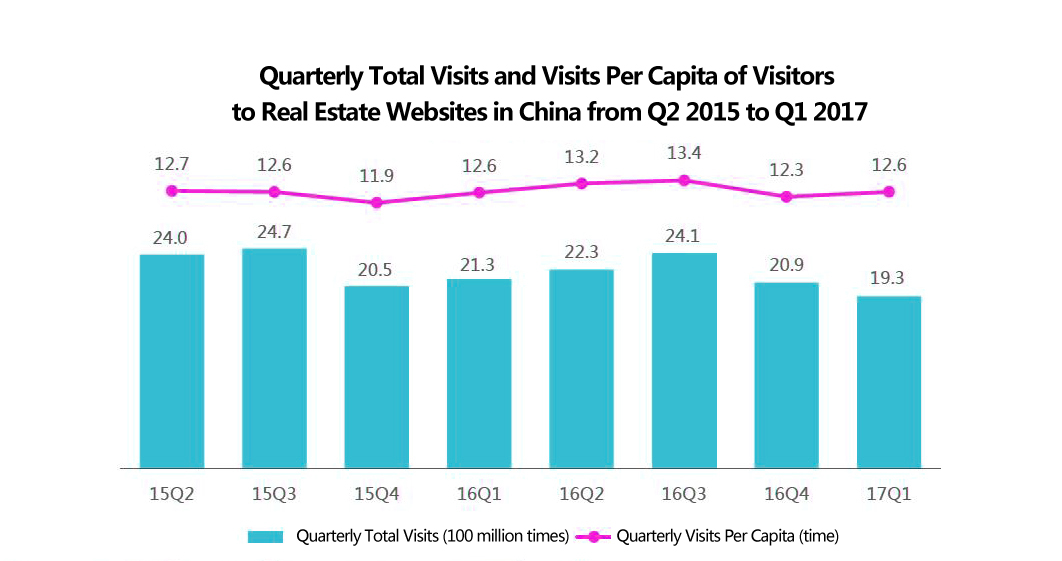
The total number of visits continuously decreased in Q1 2017.
In accordance with the monitoring data, the quarterly total number of visits by visitors on PC to real estate websites reached to 1.93 billion times in Q1 2017, falling 7.4% from the previous quarter and decreasing 9.0% from a year earlier. Quarterly visits per capita were 12.6 times, increasing 2.4% compared to the previous quarter but unchanged from a year earlier.
Overview of Visitors to Real Estate Websites on PC in China in Q1 2017
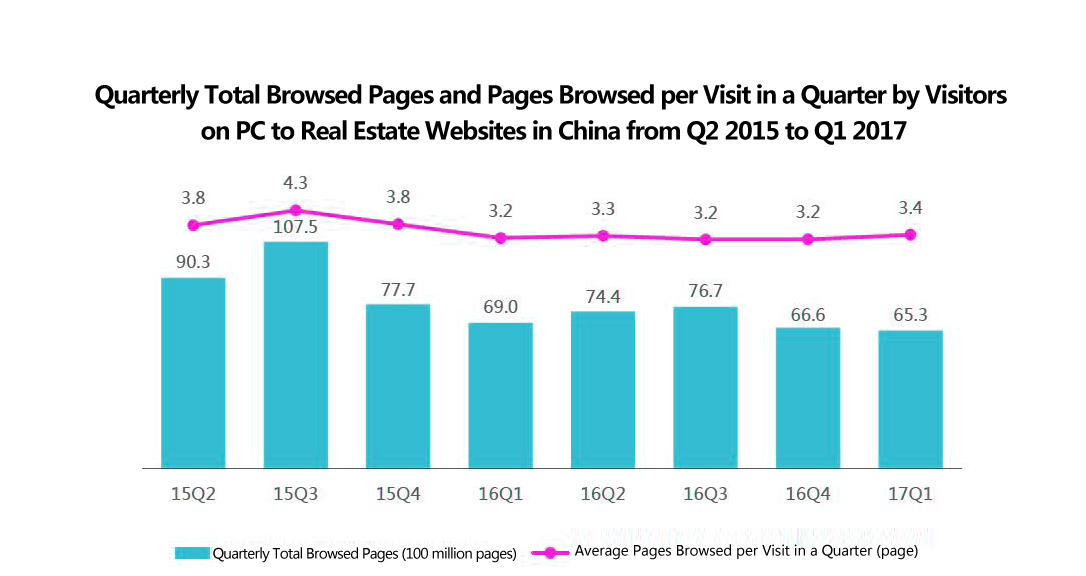
The total pages browsed by visitors decreased in Q1 2017.
According to the monitoring data, the quarterly total pages browsed by visitors on PC to real estate websites in Q1 2017 were 6.53 billion pages, falling 2.0% from the previous quarter and decreasing 5.4% from a year earlier. Within Q1, the average pages browsed by visitors per visit reached to 3.4 pages, increasing 6.3% compared to Q4 2016 as well as Q1 2016.
Read the『Important Legal Notices』for the relevant disclaimer.
The products and services on this website may not be available to users in certain countries.
Please check the sales restrictions related to the service in question for more information.
Copyright © 2012-2017 Standard Perpetual, ALL RIGHTS RESERVED.